Change your life by
managing your money better.
Subscribe to our free weekly newsletter by entering your email address below.

Subscribe to our free weekly newsletter by entering your email address below.
The average shopper may blindly pay retail price for their goods. The average investor may make rookie investment choices that cost them dearly. But Money-Guy listeners are anything but average when it comes to financial matters. In today’s show, we talk about the rewards involved with being an above-average shopper and investor.
We have mentioned in past shows that we pride ourselves on saving 3-7% more than the average person does on purchases. A couple of our favorite shopping tools to stretch those dollars are:
By using these tools along with various credit card rewards, you can shop smarter than the average person and reap the benefits of your hard work!
The second part of today’s show focuses on DALBAR, Inc.’s Quantitative Analysis of Investor Behavior. Don’t let the long, boring name fool you. The data here about what the average investor does wrong is actually really interesting.
We challenge you guys to take a look at your performance over the years and see how you measure up. If you are a Do-It-Yourselfer who has fallen prey to some of these bad investor behaviors, you may want to consider getting a professional to help you. Volatility isn’t going anywhere and, unfortunately, the average investor is using fear and market timing and apparently they are paying for it. We want all of our listeners to be above-average shoppers and investors and find financial freedom and success.
Subscribe on these platforms or wherever you listen to podcasts! Turn on notifications to keep up with our new content, including:


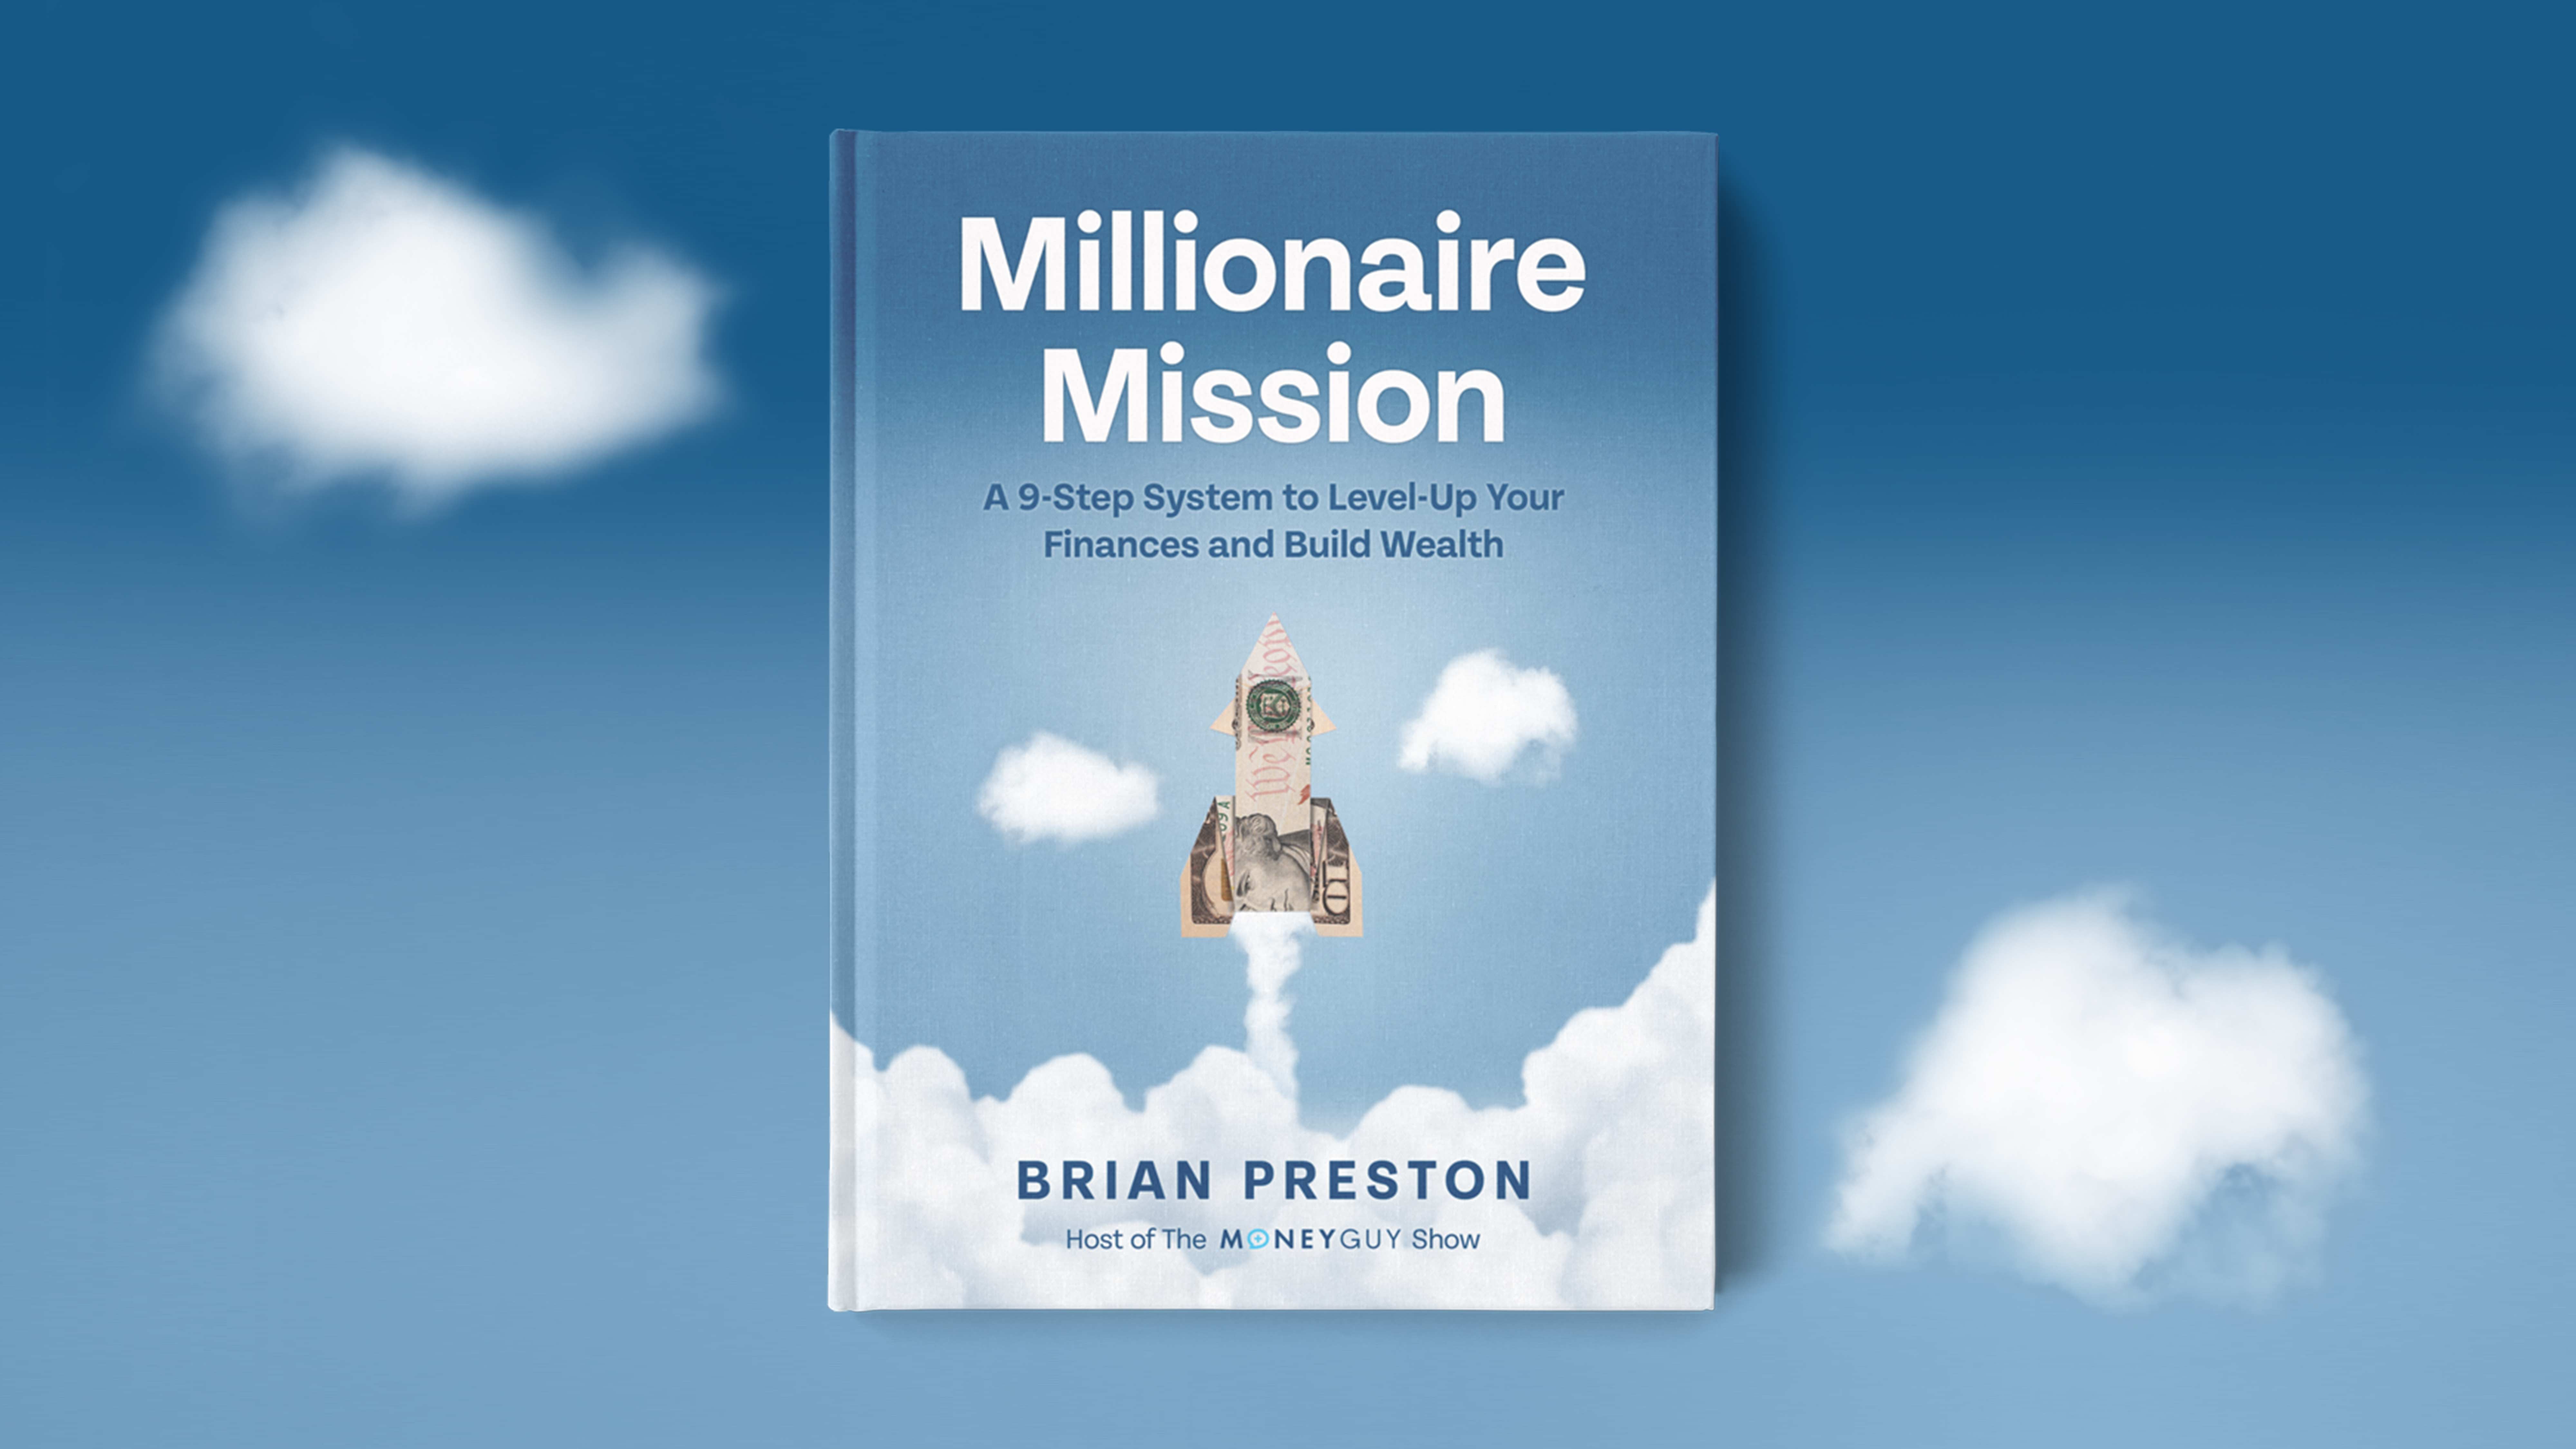
Financial Order of Operations®: Maximize Your Army of Dollar Bills!
Here are the 9 steps you’ve been waiting for Building wealth is simple when you know what to do and…
View Resource
How Much Should You Save?
How much of your income can you replace in retirement? You can replace different portions of your income in retirement…
View Resource
How To Pay Off High-Interest Credit Card Debt
Read MoreHow To Get Your Financial Life Together in 2025
Read MoreHow To Save for Retirement When You Have a Pension
Read More

How about more sense and more money?
Check for blindspots and shift into the financial fast-lane. Join a community of like minded Financial Mutants as we accelerate our wealth building process and have fun while doing it.


It's like finding some change in the couch cushions.
Watch or listen every week to learn and apply financial strategies to grow your wealth and live your best life.
Subscribe to our free weekly newsletter by entering your email address below.