The S&P 500 recently entered into bear market territory, and is currently a little over 20% down from all-time highs. Everyone understandably wants to know how long the bear market will last and how quickly we will recover. I don’t have a crystal ball, so I can’t tell you when this will end, but looking at the history of bear markets can give us some insights.
Every market downturn is unique and different. While it is true that this time is different, it is true for every bear market we experience: Black Monday in 1987, the Dot Com Bubble in the early 2000s, the Great Recession in 2008, the Covid Crash in 2020. Each of these downturns felt uniquely scary, and the variables that led us into the volatility were different, but bear markets can behave pretty similarly to one another (especially when it comes to recovery). By identifying several of these consistencies, we can get a better idea of what the current downturn and subsequent recovery may look like.
1. Small downturns are very common – and large downturns are very uncommon.
The table below, using data compiled by Guggenheim Investments, shows every single decline of 5% or greater in the S&P 500 since 1945. Declines of 5% to 10% are extremely common, occurring about once per year. These declines are also extremely short-lived, and peak-to-peak only last two and a half months, on average (peak-to-peak measures from right before the decline started until the market is fully recovered).

Declines of 10% to 20% are less common, occurring about once every two or three years. These declines are also short-lived, and peak-to-peak last just eight months, on average. Bear market declines of 20% to 40% occur about once every decade. These more substantial (and rare) market declines last about two years total from peak to full recovery. Declines of 40% or more are extremely rare and happen once or twice in a lifetime. The S&P 500 has only experienced three such declines since 1945, so data here may be skewed by an outlier.
The bottom line is significant downturns in the S&P 500 aren’t common, and they don’t typically last for prolonged periods. Fortunately, much more wealth and economic expansion is built during bull markets than what is lost in bear markets. We are currently experiencing a “once-in-a-decade” event.
2. The sharper the decline, the sharper the recovery.
Zooming in only on bear markets, since that is what we’re currently experiencing, we notice another pattern. The chart below shows every bear market in the S&P 500 since 1950, in order from smallest to largest total market decline (the bottom blue bars). The top bar is the return experienced in the 12 months after the S&P 500 hit the bottom.

For bear markets that bottomed out between 20% to 30%, the average return in the following 12 months was 39%. Bear markets that bottomed out down 30% or more returned 47% in the next 12 months, on average. The market recovers from bear markets quickly, and the further the market drops, the faster it goes back up. Which brings me to my next point…
3. Markets, in general, recover very quickly.
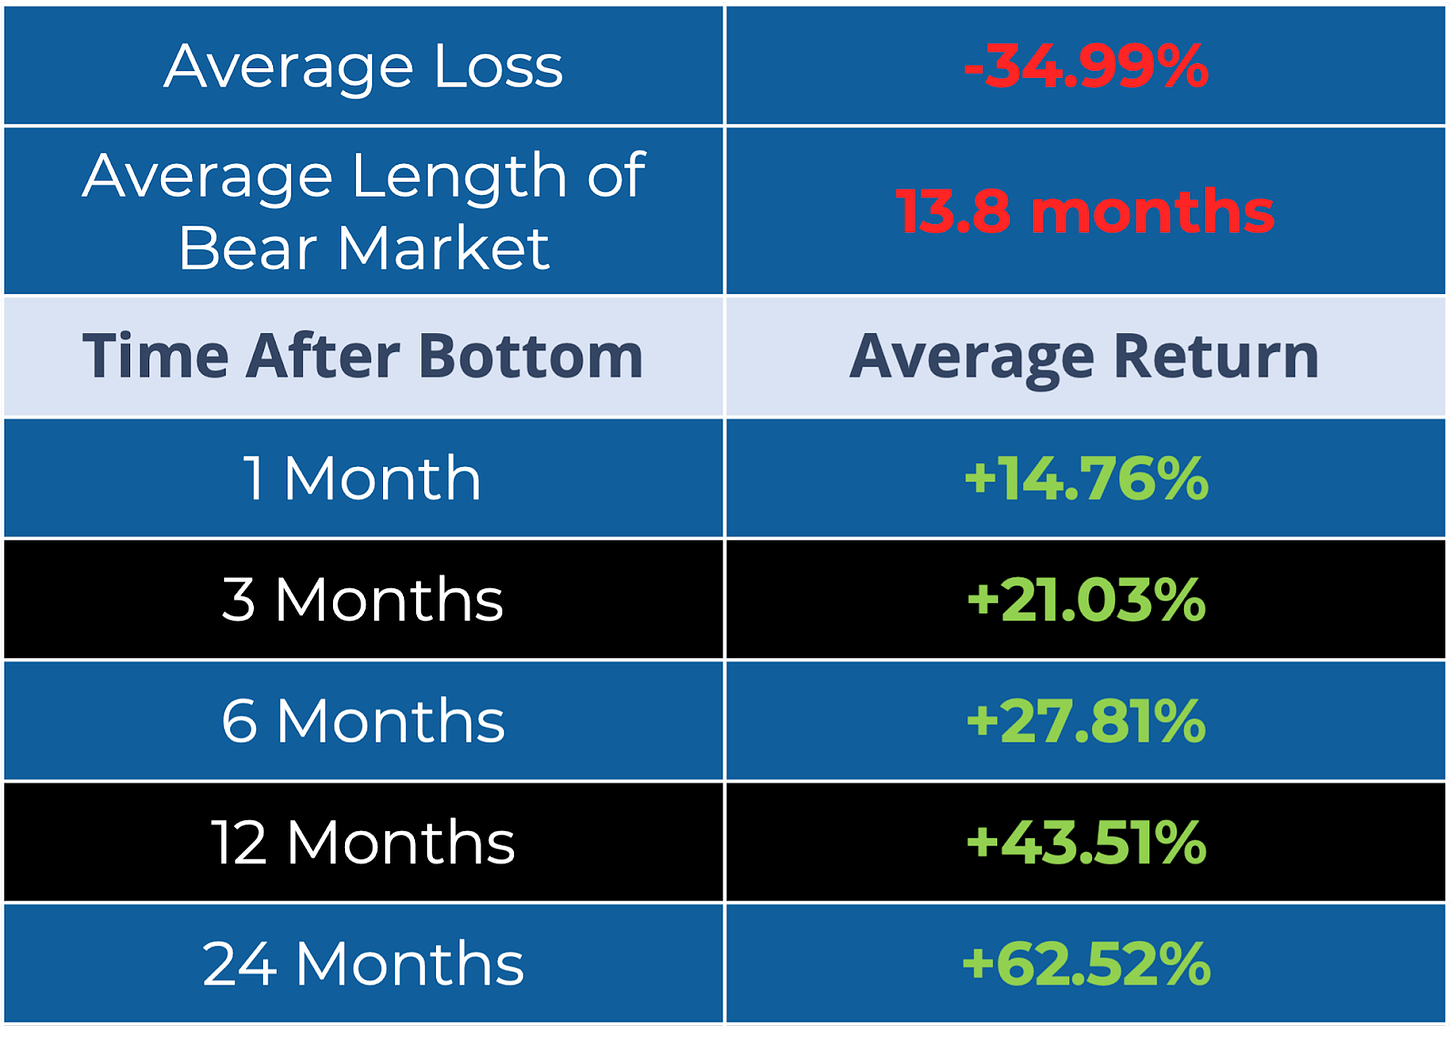
So we know that markets recover fairly quickly in the 12 months following a bear market bottom, but what does the full picture look like? The table below, using data from YCharts (not including dividends), shows the S&P 500 average return from the bottom of every bear market since 1950.

The market has a history of performing very well after hitting the bottom of a bear market. Gains experienced after mere months look like gains you’d expect over the course of several years; one-year and two-year returns are even more phenomenal. For anyone invested in equities during a bear market, this table may inspire optimism, but it should also serve as a cautionary tale.
You only get the returns in the table above if you remain invested at the bottom of a bear market. If you are older or closer to retirement, it may be tempting to switch your asset allocation to an entirely cash-equivalent portfolio to weather the bear market. If the market continues to go down, it may even feel like the right decision at first. But how do you decide when to get back into the market? It’s impossible to know when the market will turn around, and we know from the chart above that missing out on just a few months in the market could mean missing 20% or greater returns. Making big changes to your portfolio during a downturn could have big implications for your future returns. This is why it is so crucial that your portfolio be diversified to reflect your personal goals, age, and risk profile prior to market downturns (planning is rewarded and emotional reactions are penalized in the long-term).
Market downturns are scary and no fun, especially if you are closer to or in retirement. The uncertainty – not knowing how long a downturn will last or when the recovery will begin – makes downturns emotionally draining and stressful. While we can’t predict the future, the past does have some lessons for us. History teaches us a few things about bear markets. They are relatively uncommon, occurring a little more often than once a decade. The further the market drops, the faster it recovers, on average. Last but certainly not least, markets recover from downturns and bear markets very quickly. We don’t know how long this bear market will last, where it will bottom out, or exactly how long it will take to recover, but based on historical data, you do not want to miss out on the market recovery.
We recently recorded a full episode discussing how to protect your finances during a recession by each decade. Younger investors may have completely different concerns from older investors, so we felt it was important to break this show down by age. You can watch the full episode here.


