Looking for our latest Net Worth By Age episode? Check it out here. For everything else net worth-related, visit our ultimate guide to net worth.
One of our favorite annual shows is our Net Worth By Age series. Although comparison can be a thief of joy, seeing how you stack up to other Americans the same age as you can help determine if you are behind or ahead of the curve. This information can be tremendously valuable to know if you need to adjust course by saving/investing more or take a moment to recognize you are crushing the journey to financial independence. However, the median American may not always be the best marker of success, so we’ll discuss some other indicators to keep an eye on as you track your own net worth.
Net Worth By Age: 20s
Assets
In your 20s, you may not be that excited about your net worth. It probably isn’t very significant yet, and may even be negative. What you don’t have in assets is offset by the fact that you are a billionaire of the valuable resource of time. This tremendous advantage in your 20s means any dollars invested are more powerful than they will be at any point in the future, so invest as much as you can! When looking at your annual net worth statement or our Net Worth Tool, focus on covering your deductibles and building your emergency reserves, taking advantage of your employer match, and contributing to your Roth IRA and HSA. Investing 20% to 25% of your gross income for retirement is the eventual goal, but it is okay if you don’t get there in your 20s. Don’t worry if your net worth statement looks unimpressive. Focus on building positive financial habits, like investing automatically every month, that will last for decades.
Liabilities
Liabilities are very easy to accumulate in your 20s, and this can easily turn into a financial trap. You may be going to college, buying a car, and opening your first credit card. It’s very important, not just in your 20s but for your future self, that you don’t allow the liabilities section of your net worth statement to get out of control. Follow some of our basic debt rules to help stay on-track:
- Keep total student loan debt below your expected first year salary out of college.
- Follow Money Guy’s 20/3/8 car affordability rule when purchasing a vehicle (put 20% down, pay the car off in 3 years or less, and make sure the monthly payment is no more than 8% of your gross income).
- If you have credit card debt, get rid of it as quickly as possible (although maybe not before covering your deductibles or getting your employer match).
How do you stack up?
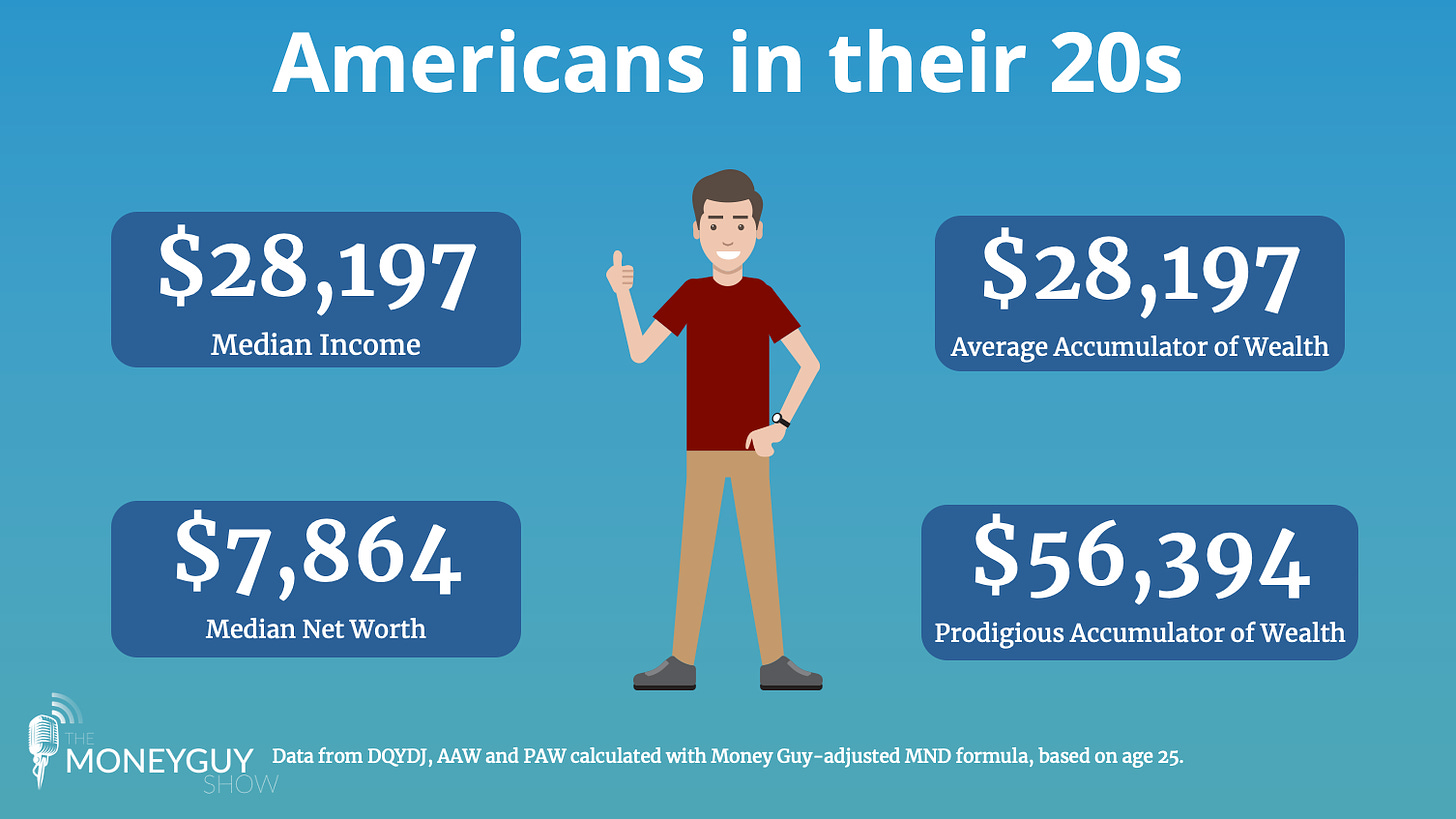
Based on data compiled by DQYDJ.com, the median American in their 20s makes about $28,000 per year and has a total net worth of just $7,864. Many Americans in their 20s have a negative net worth, so it is certainly not the end of the world if your net worth has more potential than tangible assets at this stage. Based on the Money Guy-adjusted Millionaire Next Door accumulator of wealth formulas, an average accumulator of wealth (AAW) in their 20s has a net worth of about $28,000, while a prodigious accumulator of wealth (PAW) is worth about $56,000.
Net Worth By Age: 30s
Are you excited yet?
If you’ve been tracking your net worth throughout your 20s, chances are you are seeing some significant progress by the time you reach your 30s. You may have been contributing to your 401(k) and Roth IRA for years and have a solid foundation built, including a full emergency fund, brokerage account, cash savings, home, and more. All of these assets will contribute to your net worth in your 30s, and liabilities – such as student loans and auto loans – may be less or gone altogether. This is also part of the messy middle phase of life where you may be in the middle of growing your family with kids and buying that first house. These are big milestones that can be quite a bit to digest, both emotionally and financially. The good news is that with the right focus and using the tools we share at MoneyGuy.com you will make it through this period that has the days feeling long, but the years will pass quickly.
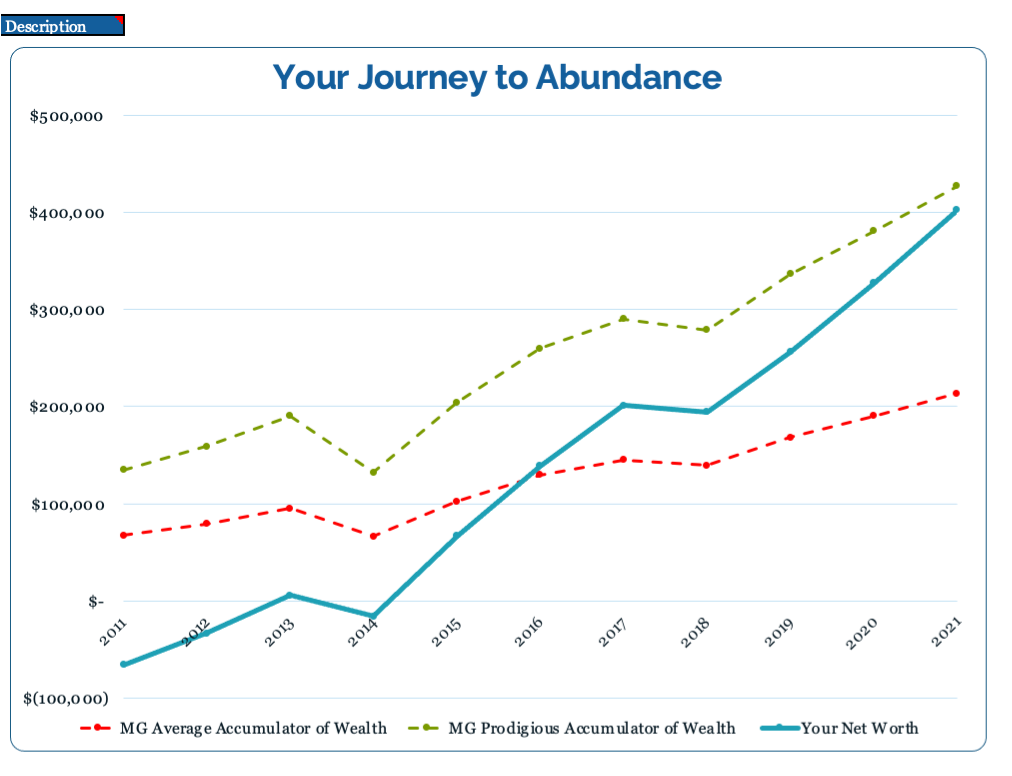
The chart below shows what your net worth journey may look like as you get older. Notice on the left side of the chart, net worth begins negative, and gradually increases over time – but not in a straight line. Some years your net worth may go down, even if you’ve been saving for decades, and that’s okay. More important is the overall trend when you zoom out. If you are investing 25% of your income for retirement and following Money Guy debt guidelines, your net worth should increase over time.
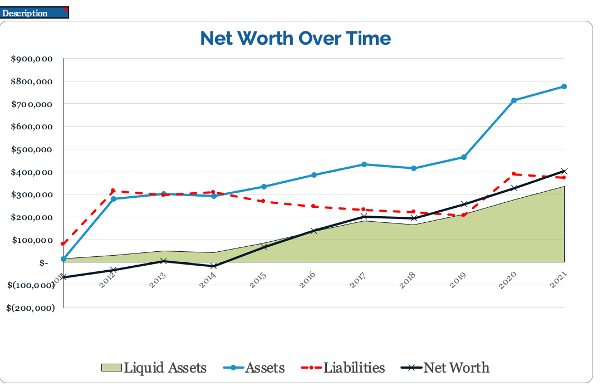
Like this chart? It’s part of our Net Worth Tool, available at learn.moneyguy.com.
How do you stack up?
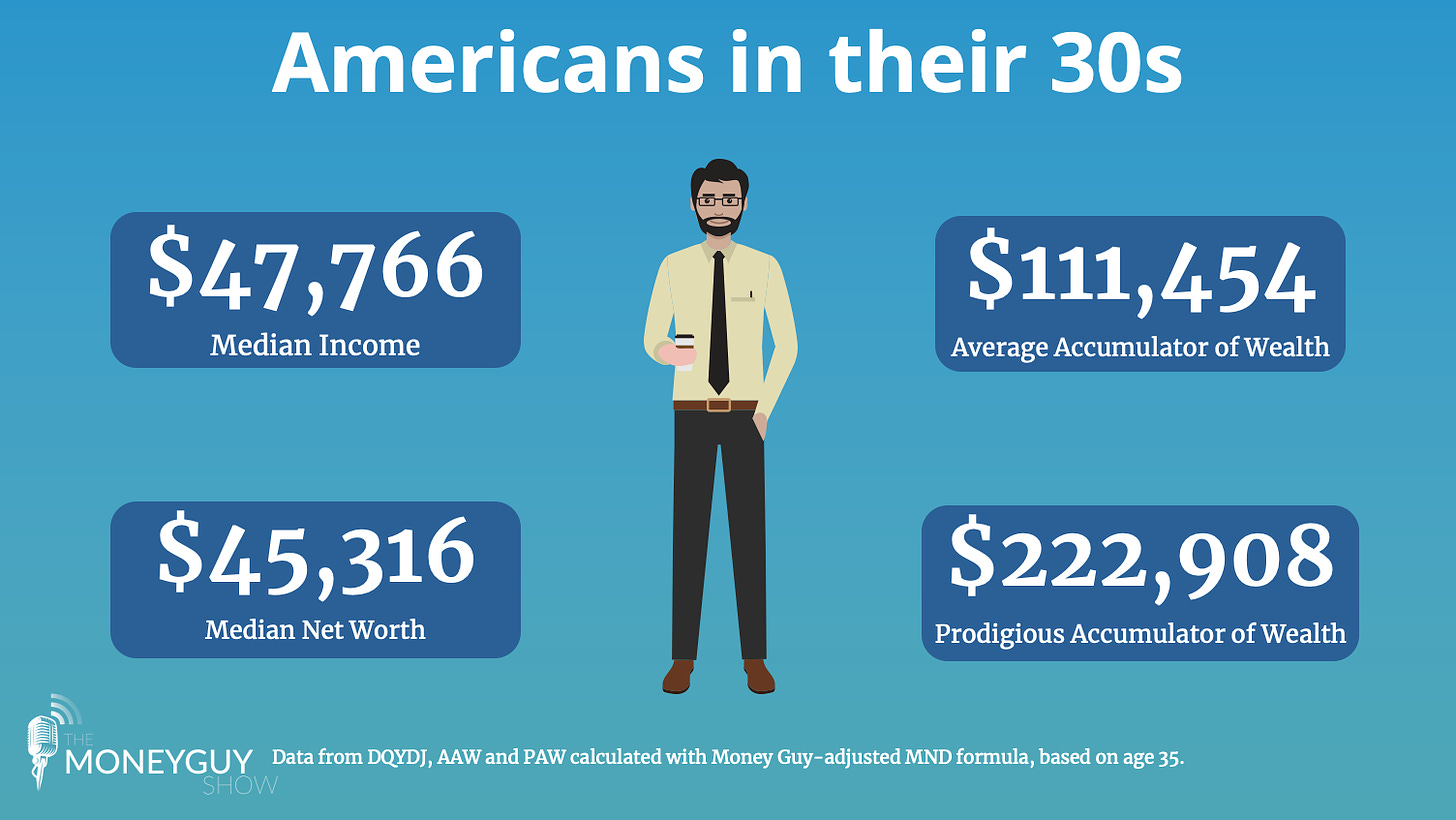
In their 30s, the median American is making about $48,000 per year and is worth $45,316. According to the Money Guy-adjusted Millionaire Next Door formulas, though, an average accumulator of wealth at that income should be worth $111,454, with a prodigious accumulator of wealth worth $222,908. This means the median American is significantly below average when it comes to the AAW metric.
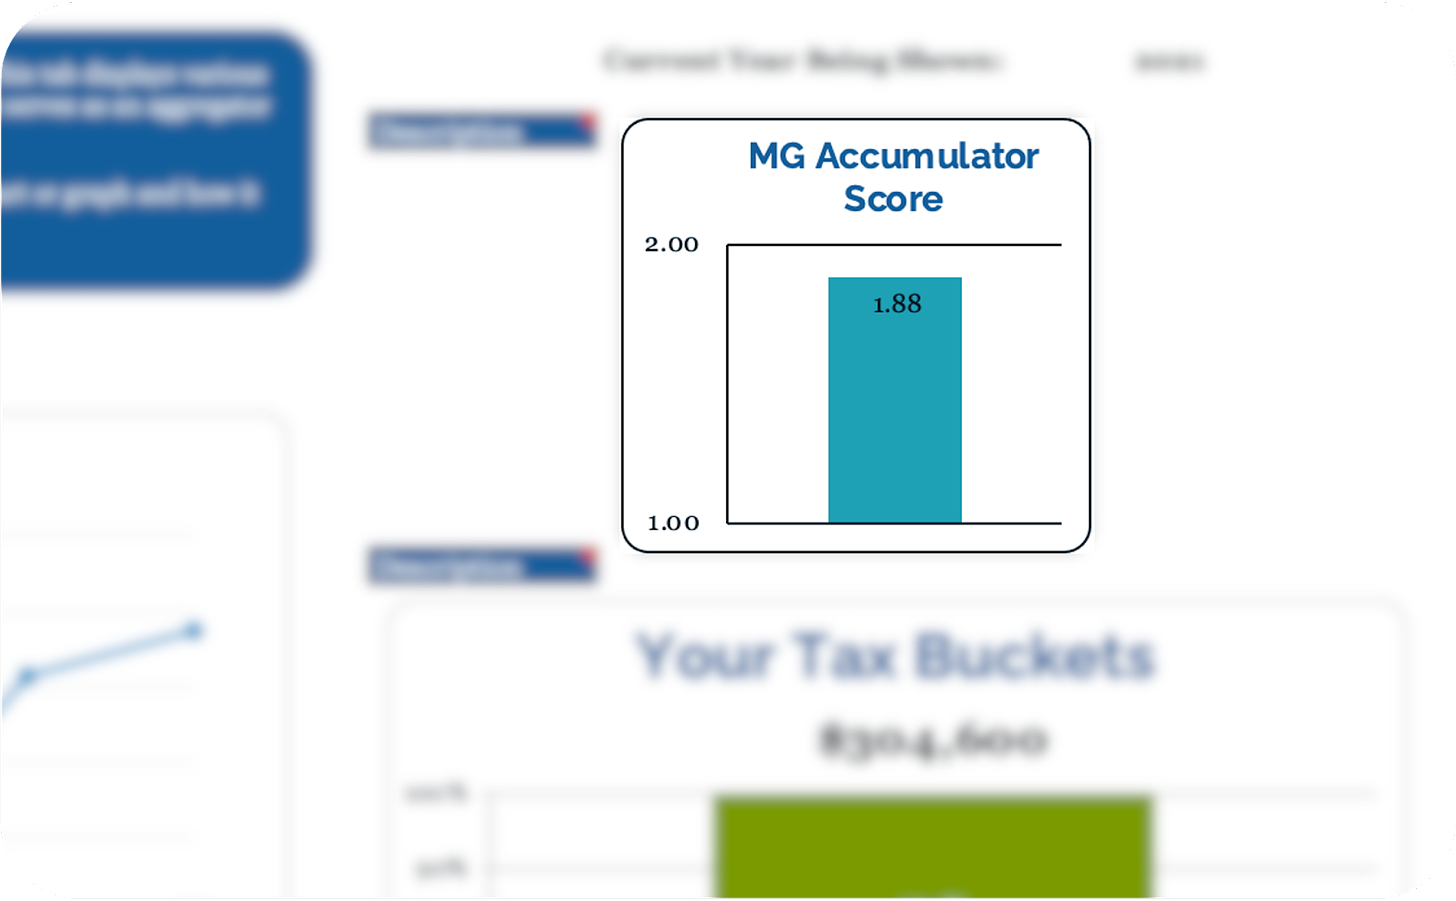
Our Net Worth Tool includes a similar metric, the Money Guy Accumulator Score. This number calculates automatically based on what you make and your overall net worth.
Net Worth By Age: 40s
Your Journey to Abundance
As you reach your 40s, it’s time to appreciate how far you’ve come and where you are going or buckle down and get serious about investing for retirement. As you get closer to retirement, asset location and tax buckets become more of a focus. When your portfolio reaches a critical mass, which can happen when crossing over $500,000 in invested assets, previously minor concerns like portfolio structure and asset location become a more serious matter.
The following chart is taken from our Net Worth Tool, which displays how much you have invested in each taxable bucket.

Maintaining a harmonious balance between the three buckets is crucial to properly planning for taxes in retirement. What does this mean? If you are significantly overweight in one tax bucket, let’s say the tax-deferred bucket, you could be in for a significant amount of RMDs (and taxes) once you start taking distributions. If you are significantly overweight in the tax-free bucket, it could mean your tax liability in retirement will be extremely low. While that will be incredibly valuable for retirement, we need to make sure you have enough in the after-tax brokerage accounts so you can pay cash for new cars or bridge your retirement cash flow if you plan to leave the workforce early (before 55 for 401(k)s and 59½ for IRAs). If you have questions or aren’t sure if your strategy is optimal, mapping out the asset allocation and location of your portfolio is just one of many services offered by fee-only, fiduciary financial advisors. We have a great resource with eight questions you should ask your financial advisor, or potential financial advisor, on our website.
How do you stack up?
Median Americans in their 40s are doing significantly better than in their 20s and 30s – the median income is $51,411 and the median net worth is $145,771 – but they still aren’t where they should be according to the average or prodigious accumulator of wealth formulas.
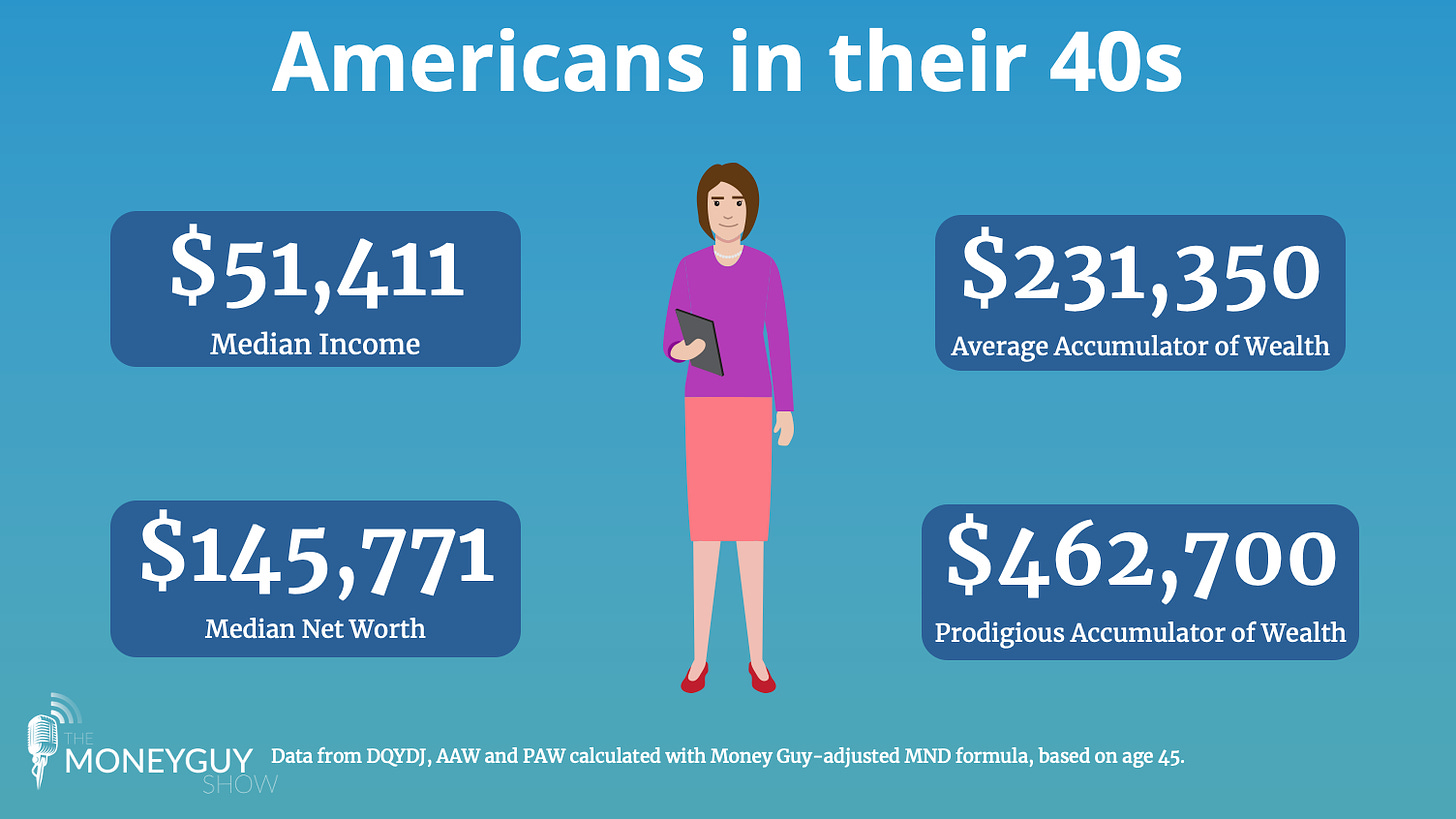
If you are wondering how you stack up in your 40s to these metrics, our Net Worth Tool tracks Your Journey to Abundance over time. You can see exactly when you cross into average accumulator of wealth territory or when you become a prodigious accumulator of wealth.
Net Worth By Age: 50s
Tracking your net worth in your 50s is probably more exciting than it has ever been. You are likely still working, in your peak earning years, and your Army of Dollars have likely grown to the critical mass point that may actually be working and earning more than you can in your day job. A very special point in your financial life is when your invested portfolio makes more in a year than you do from working with your hands, back, and brain. Our Net Worth Tool tracks this metric so you can tell if your portfolio is making more money than you are. That is a big threshold to cross and should be celebrated!

Your 50s is a time to review parts of your net worth statement that may have been neglected when you were younger. Take a closer look at Social Security benefits, any pensions, and your potential need for long-term care insurance. This may also be the point that you consider bringing in a co-pilot to ensure your hard work and wealth building is optimized so you get the best transition into retirement possible. A good stress test of your retirement assumptions as well as uncovering any blindspots in your plan could be tremendously valuable. This will be your first retirement with many unknowns. Consider bringing in a resource that has experience with navigating this situation so you do not have regrets or missteps later.
How do you stack up?
The median American in their 50s makes $54,245 per year and is worth $182,435. This is not great considering the median net worth includes all retirement savings and the value of assets such as homes. Many Americans in their 50s and older are still burdened by debt, whether that’s a mortgage, student loans (for a child or grandchild), auto loans, credit cards, or something else.
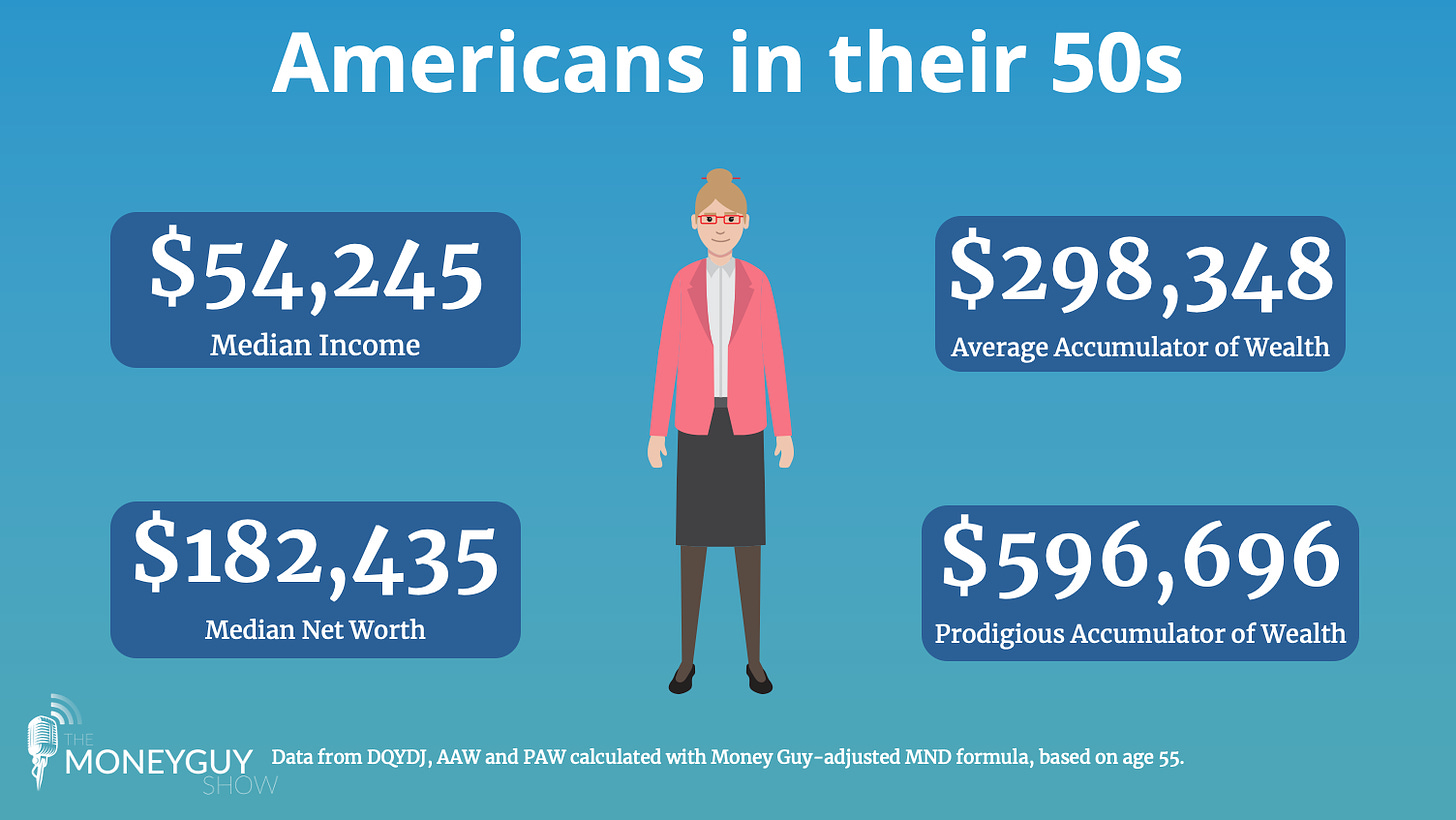
It’s fun to see how you stack up against your peers, but comparing yourself to the median American may not give you the best idea of how well you are doing financially. Our Net Worth Tool has several key metrics, many of which are shown above, to give you an idea of where you’ve been, where you’re at now, and where you’re headed. Our Net Worth Tool uses your own data, going as far back as 2006, to show your net worth over time, accumulator score, taxable buckets, and more. The tool is available for just $29 at learn.moneyguy.com. It requires Microsoft Excel, but is compatible with the free online version of Excel.
We believe that tracking your net worth and completing a net worth statement, at a minimum annually, is crucial to knowing how your financial life is doing. It’s difficult to know how you are doing if you aren’t keeping track! As completing a net worth statement becomes an annual tradition in your household, if it isn’t already, we hope you look forward to our annual net worth content as much as we look forward to creating it.


