Change your life by
managing your money better.
Subscribe to our free weekly newsletter by entering your email address below.
Subscribe to our free weekly newsletter by entering your email address below.


TikTok says it’s impossible for Gen Z to get ahead, but what does the data actually show? In this episode, we analyze income levels, inflation rates, housing prices, spending patterns, and more across two generations to answer the question: Was it easier to build wealth then or now?
From median household income that’s actually higher today (inflation-adjusted) to housing prices that have skyrocketed 50% post-pandemic and college costs that have increased exponentially, we break down the math to show you what’s changed, what’s stayed the same, and what it means for your financial future.
If you’re trying to build wealth in 2026, this episode reveals the headwinds you’re facing, the unique advantages you have access to right now, and the framework to take control of your financial future regardless of which generation you belong to. We cover the real affordability crisis in housing and education, why every generation faced different struggles, and the three generational advantages that make wealth building easier today than ever before.
Subscribe on these platforms or wherever you listen to podcasts! Turn on notifications to keep up with our new content, including:


Brian: Baby boomers, they had it so easy. At least that’s what you hear on TikTok from people who seem to think it’s impossible to build wealth today. But are they right?
Bo: Brian, I am so excited because today we’re going to do a full breakdown of the data, including income, home prices, interest rates, inflation, and even college costs to see if we can get a more complete picture of just how today’s generation fares when we compare them to the baby boomers, and more importantly, what it means for your finances.
Brian: So, I’m Brian, he’s Bo, and we’re financial advisors here to run the numbers and settle this debate once and for all. And with that, let’s dive right in.
Bo: All right, Brian. So, what we’re going to be doing today is we’re going to compare the numbers from 1980 to right now in 2026. I feel like there’s an important disclaimer that we ought to put out there because we’re going to look at how the different generations fared. You are not a baby boomer.
Brian: I’m actually a young Gen Xer.
Bo: A young Gen Xer. I am not a generation Z. I’m a millennial. So, we actually sit inside in between these two generations. So, do not throw the daggers. Do not throw the arrows at us because all we’re going to do today is we are going to explain what the numbers look like then, what the numbers look like now, and what you should do about it when you have that information.
Brian: So, since we’re going to be sorting the data, I think it’s important that we jump right in and share what are the dates of birth for these generations. For the baby boomer generation, this includes people who were born between 1946 and 1964. So, if you were born right in the middle of that range, you’d be around 25 years old back in 1980.
Bo: Okay, perfect. 25 year olds in 1980 relative to what we’re going to assume are 25 year olds starting out today in the year 2026.
Bo: And so, let’s think about this categorically. Maybe the first place to start, first place to jump in is let’s just talk about income, how much people are earning and what the earning power looked like. Well, if we look at the median household income back in 1980, it was $17,020 per year. But we recognize that that money back then is not worth the same as it was today. So, if we bring that up to today’s dollars, that’s the equivalent of about $68,000 of salary in today’s dollars.
Brian: Well, and I love that we have that adjustment built in. But, you’ll notice this is a trend that we’ll do throughout this show. So, we have to bring things forward so we can truly get into the data set here. And so when you compare that $68,000 to where we are today, household income today is $83,730. I was shocked because you hear about all these struggles. It’s actually higher now than it would have been inflation adjusted for where people would be.
Bo: Yeah, that’s the big takeaway. When we think about income in isolation, it’s gone up even adjusted for inflation. It’s over $15,000 higher than it was in 1980. So obviously folks are making more money today than they were making in 1980. But I can already hear people saying, “Yeah, yeah, yeah, guys, but things are more expensive. Things cost more.”
Bo: So now let’s talk about inflation. And we know that inflation is just simply the general increase in the prices of goods and services over time. Something cost X number of dollars in the past and because of inflation, it cost X more dollars today for the same good or same service.
Brian: Yeah, I think it’s interesting. And we actually pulled the data and we found out from 1980 all the way through 2025 that the cumulative price increase is around 290%. So if you annualize that, it works out to be 3.07% inflation rate.
Bo: I think it’s worthy of just pausing there for a moment. Even though we think about hyperinflationary periods and all this stuff, we’re looking at almost a 50-year data set here. And the average rate of inflation over that 50 years, over different market cycles, different types of environments was about 3%. Pretty consistent through time.
Brian: Now, we then said, okay, well, this means from a simple math perspective that goods should be four times more expensive than they were in 1980. Now, this is where all the people who just saw what we did with income, you’re going to now be able to, we’re going to be able to compare and contrast specific categories to see are things cheaper inflation adjusted or have they run up in price much more than they should have even with taking inflation into account.
Bo: So, we’re going to look at some consumer goods. Let’s just start with a loaf of bread. If you look at the price, the cost of a loaf of bread in 1980, it was about 50 cents for a loaf of bread. Today, a loaf of bread costs about $1.81. So, it went up 3.6 times. So, we’re pretty close right there to that four times.
Brian: A little less. So, you see that bread’s a little bit more affordable now than it was even back then, inflation adjusted.
Bo: Sure. All right. So, what about a gallon of gas? In 1980, a gallon of gas cost $1.22 per gallon. Today, it’s a little over $4 a gallon. So gas you would say is 3.3 times more expensive.
Brian: Which is interesting, once again a little less than you would anticipate. Now all of you who are younger and you’re like wait a minute, this seems like they’ve got their thumb on the scale for the boomers, don’t worry guys because this is what you’re going to see, is you’re going to notice a trend because we’re shooting you straight like I said, we are just objective observers, not even part of either one of these generations. Let me show you the other side of this where you are going to say, “Okay, now they’re really kind of sharing what’s going on.” 1980, if you can believe it, a car was $7,557. Go watch our old game show clips, right? And it’s just fascinating when you see Bob Barker showing these cars and you see how cheap it is. Today, a car is $49,191. If you do the multiplier on that, it’s 6.5 times more expensive. Remember, it’s only supposed to run up four times. We just did basic inflation. Cars have gotten significantly more expensive than they did back in the past.
Bo: And when you even think in relative terms, in 1980, the price of a new car was around one third the median household income. If you look at the price of a new car today, it’s over half of the median household income. So automobiles have certainly gotten more expensive.
Bo: So then the question you may be saying is, okay guys, I understand that, but inflation rates change over time, right? We look at the change of prices year over year, but sometimes we might be in high inflation periods and sometimes we might be in lower inflation periods. We said okay well let’s look at the different periods. We know that in 1980 inflation actually reached a high of 13.5%, which is I would argue a hyperinflationary environment.
Brian: Well, and that’s what’s so unique about us using this case study or these periods of time is that they have a lot of similarities in the fact that in the early 80s we did have this weird period where inflation was in this hyper-accelerated state. Well, you know what we just came through, this pandemic where once again we had a heightened state of inflation. But it is interesting to note that inflation right now is 2.4%. However, we did just come through, like I said, post-inflation, mid 2022, when kind of all that was working its way through the system, we had inflation around 9%. So, both of these periods have in common is that they had much higher inflation than historically what is normal.
Bo: But it is important to note that prices are higher now than they were then. But the baby boomer generation, they did face higher inflation when they were coming out, when they were starting their careers, than what we’ve seen in recent years. That’s not to minimize how painful 9% inflation was, but it’s more to level set that 13.5% inflation is indeed worse than 9% inflation. Just worth noting.
Brian: I think a lot of people, they’re going to say, “Okay, you guys just did some basic household expenses between the bread, the gas. Okay, you threw me a bone with yes, cars are significantly more expensive. Let’s talk about the elephant in the room. How about housing? What has actually happened with home prices? I’d love to see an objective analysis of the data on that.
Bo: So again, if we look at the median home price in 1980, it was $64,600. If we bring that up to the price in today’s dollars, that’d be the equivalent of about a $259,000 house was the median home price in 1980.
Brian: Now, here’s where you guys are going to see the separation to a degree is look at the median home price today, over $450,000. Way different. Now, look, I tried to balance this out a little bit and I thought it was interesting. If you think about how the world is changing through innovation, a house in 1980, the average square footage a little under 1,600 square feet. Okay. The new houses being built now, the typical home is a little over 2,100 square feet, a little under 2,200. The houses are bigger now. So, the houses are bigger, but still, I would still argue that and I would give that credit to, you know, support structures and other things. They can build bigger homes for cheaper, but unfortunately has not translated to cheaper prices because houses are definitively more expensive now.
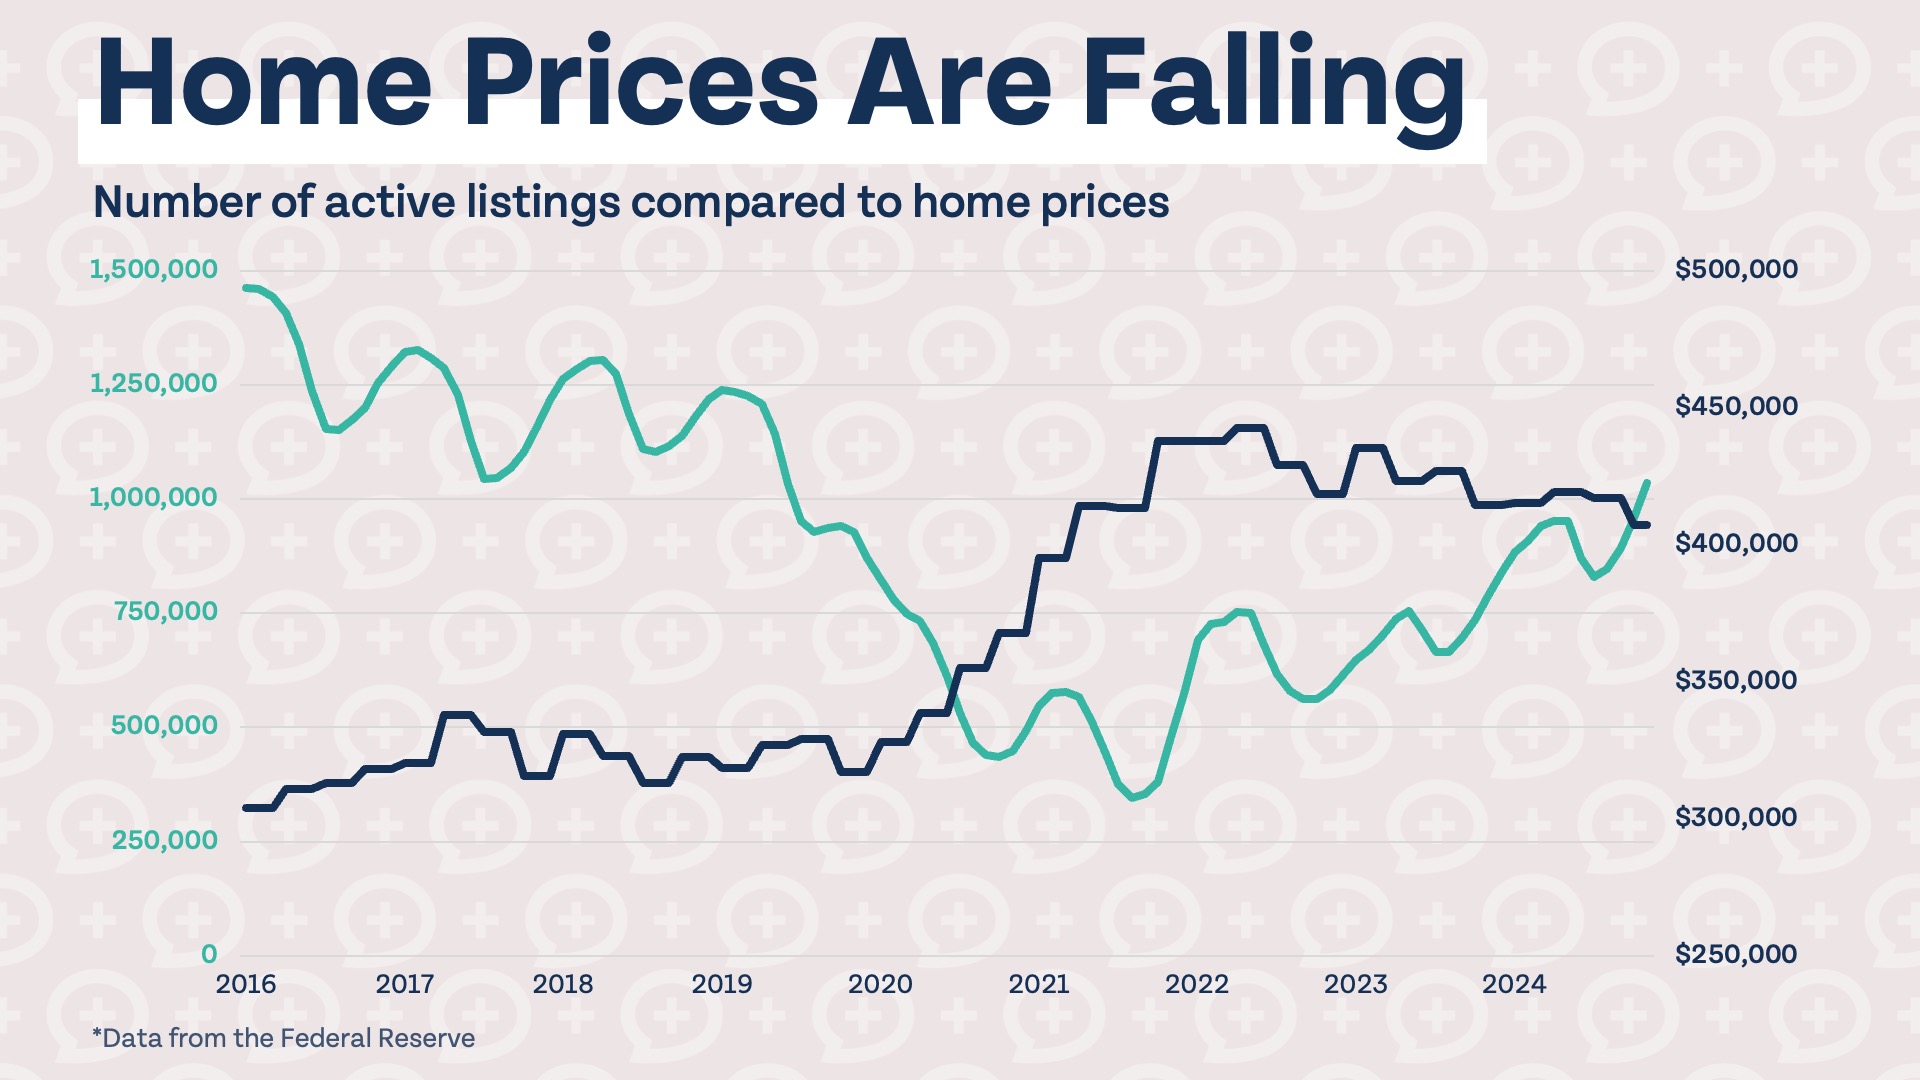
Bo: So, we can take these two points in time, the 1980 point in time and the 2026 point in time, but I think that’s doing a little bit of a disservice to housing because if we actually look at the median increase in house prices in the United States all the way from the 60s through now, what you can see is that it was a fairly steady line, like it was kind of moving in what I would say is a realistic pace, a realistic increase. But there was in fact a very unique thing that happened post-pandemic. We saw a season where home prices rose exponentially in a very very short period of time. Even though we saw a recovery post 2008, post great recession, it was not to the same extent that we saw post pandemic. So house prices did go up more rapidly in recent memory than they have really over the last 50, 60, 70 years.
Brian: Yeah. I won’t, because I know we’re going to have podcast listeners who don’t unfortunately get to see this visual. You should go back and watch the visual of this because if you look at the hockey stick that occurred right after 2020, it is amazing that housing prices went up in a lot of markets over 50% within a three-year period. Huge. That has created this weird thing. This conversation would be completely different if we were running this affordability analysis in 2020. Not only from the interest rate side of things, but also on the standpoint of what the purchase price is. So, a lot of that’s why we wanted to make sure we share this data with you because where we are right now, it has definitely elevated the purchase price for housing in the United States.
Bo: Yeah, it’s interesting that you use the term affordability because when we think about how affordable was a house in 1980 relative to how affordable it is now, if we assume the median household income, we know that in 1980 the house price to income ratio, meaning how many multiples of income would it take to buy a house in the United States is about 3.8. If we fast forward to now in 2026, that number has now risen to 4.8. The median price of a home today is 4.8 times the median income of a median income earning American. That number was only 3.8 in the 1980s.
Brian: So, we can definitively say two things. Housing prices have definitely risen dramatically relative to income. Housing prices have also increased much faster than overall inflation since 1980. So, if you feel like buying a house has gotten harder, yeah, you’re right. It has gotten harder.
Bo: Well, technically yes in terms of price, but there is another thing that factors into the equation, right? We have to think about when it comes to buying houses, most people are not able to pay cash for a house. They have to go out and borrow money to do so. So then we said, okay, well, what if we analyze where were interest rates in 1980 versus now? Because obviously price is one metric and then borrowing ability or capacity is the other. In 1980, if we look at the average interest rate that was present for a mortgage in 1980, it was actually 13.74%. Again, this is a hyperinflationary time. Mortgage rates super super high. That’s pretty daunting.
Brian: Yeah. And interest rates right now, 6.36%. Now, I will, when we come back and look at this data, I will say that moment in time in 1980, that’s more of an outlier than I think it’s a normal. We have a whole chart to show that. But it is interesting to say in 1980 specifically, close to 14% for mortgage rates. Currently we’re just under 6.4%.
Bo: So one of the things that’s been interesting over this time period is again if we look at the cost or the 30-year fixed mortgage rate in the US from 1970 till now, you can see that right there in the 1980s is when it hit its all-time high, right there in the early 80s. And really from 1980 or a little bit thereafter all the way through post pandemic 2021, we’ve sort of been in a pretty steadily falling interest rate environment. Now obviously there have been fits and starts and ups and downs but by and large it’s been moving to lower and lower and lower levels, bottoming out right around the 2020, 2021 period.
Brian: Yeah, if you think about that, that essentially created a wind to your back if you were trying to think about affordability of housing because as interest rates were going down over that 50-year period, the lower the interest rate, the lower the cost of your monthly payments was. And that’s why it’s probably such a stark contrast is that we went from mortgage rates which were around 3 to 4% to then we spiked them up to 6 to 7%. Definitely had an impact on what was going on with housing prices.
Bo: So when we compare the two generations, relatively, although houses were less expensive in 1980, borrowing was more expensive. It was a more difficult thing to do back then. So we said, okay, houses are cheaper but borrowing is more expensive. How much of wallet did housing occupy? So if we think what is the median monthly payment then versus the median monthly payment now. Well, if we calculate that in 1980, the median monthly payment, if we just assume principal and interest on a 30-year fixed mortgage with the median down payment of 28% down, which was the median down payment in 1980, it was a $542 per month mortgage payment, which represented about 38% of median household income. In today’s dollars, that’s the equivalent of about a $2,172 monthly mortgage payment.
Brian: When we were digging through the data, the other thing I thought was crazy is do you know what the average down payment was back then? 28%. And look, what I attributed that to is that more of the banks were self-sufficient, meaning that their underwriting process was substantially harder back then and they required you to have much larger down payments to even be considered qualified to buy this house because there weren’t as many programs where the federal government backstopped it in a lot of ways. If you then fast forward and look at what we’ve done now, it is interesting that the typical payment now is within a few dollars like $2,165. Now look, we chose a moment in time, 1980, like we said, interest rates were substantially higher right then. But it is, as a percentage of income, 31% of income and it’s still the down payment now, you know, if you look across all bodies of the data is around 19% because you know younger people are putting down lower amounts, our rules take that into account, older people are putting down larger amounts, but it’s still 31% of median monthly income.
Bo: So, the takeaway here is homeowners today are actually spending a smaller percentage of their income on housing than homeowners were in 1980. But we would make the argument both of them are too high. Whether you’re spending 38% of your income on housing or 31% of your income on housing, you’re still running afoul of the Money Guy rule. Because when it comes to housing, when it comes to making sure that you don’t buy too much house, we want you to follow the 3/5/25 rule. That’s when you put your down payment, you only have to put down 3% if it’s your first home. We want you to make sure that you’re in the home for at least 5 years. And we don’t want your monthly payment, your principal, interest, taxes, insurance to exceed 25% of your monthly gross income. Well, obviously on the median in 1980, they were exceeding that. And even today still the median American is exceeding that.
Brian: I wanted to talk about just the general homeownership then versus now because I thought this was another one of those shock and a surprise moments when I was analyzing the data. The home ownership rate in 1980 was 65.5%. Okay. American dream, buy a house, getting a home, 65 and a half percent of them. Now, here’s what’s so odd to me is that I’m old enough that I’ve seen enough administrations come out. I remember this is bipartisan because President Clinton when he was in office, he wanted to make homeownership a big part. He wanted to support the American dream. Fast forward, George W. Bush had all this home affordability. That was a key issue for his presidency as well. Fast forward and here we are in 2025. What is the home ownership rate in 2025? 65.5%. How in the world do you have all this involvement and all these things going on and then the home ownership is pretty much level set to exactly where it was in 1980?
Brian: Now go deeper into the data. And all my young people, I hear you. I see you out there right now. You’re watching this, go, wait a minute. You can’t just say that the data is the same. You’re exactly right from a generational standpoint. Here’s where the shocking part is. The median age for first-time home buyers in 1980, 29 years of age. That’s what you’re supposed to do, right before you start the messy middle or right as you’re getting into the messy middle of growing your family, starting to have kids, you buy the house, American dream is alive and well. Fast forward to where we are right now. Median first-time home buyer, 40 years of age. That’s a problem because now you’ve got a disconnect from when people are getting in the messy middle, when they’re getting to that first house. So even though the data is the same on home ownership percentages, I do think younger people are getting priced out to where they’re having to make the home purchase decision at a later age.
Bo: So one of the questions you have is, okay, well why are young people pushing this out? Is it something they’re choosing to do? Are they being forced out there? We said, okay, well, let’s look at another cost that often impacts young people and disproportionately impacts younger generations relative to older generations. And this one makes me mad. And we said let’s look at the cost of higher education. So we went and pulled looking at public and private universities. If you just look at the annual tuition and fees in 1980 for a public university and a private university, it’s about $800 and $3,600 per year. Per year, by the way. Even if you bring it up into today’s dollars, that would be average or median public tuition of about $3,200 in today’s dollars. And for a private school, about $14,500 in today’s dollars is what it would cost to go to college. So you go to a private school and in total pay $60,000 for your full education.
Brian: Well, I think it’s interesting. When I went to University of Georgia back in the early 90s, my annual tuition was around $3,000. So right in line with what we have here for the public universities. This is going to be the stuff that makes you mad because remember guys, I love education. I always say it’s the ladder of opportunity to make yourself a better version of yourself. We’re going to start asking ourselves that is a true statement that bettering yourself is good, but at what cost to your future self if you’re having to pay a fortune for the education? Because look at what it costs. Public education now is $10,340. Private school is just under $40,000. Unbelievable, guys. What in the world? This seems completely disconnected from the inflation rates we were just talking about.
Bo: Yeah. And again, we think about these in relative terms. In the 1980s, the cost of a public school education represented roughly 5% of the median household income. And if you went to private school, it only represented about 21% of the median household income. Fast forward to today, for a public university, it is now 12% of median household income. And a private university is almost 50%, and it is 47% of household income. So relative to income, the cost of education has risen exponentially. So folks coming out of school, it’s no wonder now they have to graduate with student loans and have all this debt. It is a very different situation today than it was back then.
Brian: Well, and look, we’ve gone through these data points independently, but that’s not how life works. Life is that we actually, we don’t just choose housing or a car purchase and that’s all we have to focus on. No, these all kind of intersect and work together. So, what really troubles me is when you’re 18 years of age and you have to make the decision, am I going to better myself through education? And then the only way typically you can afford these crazy costs is through leverage or through debt. You have to go take this debt on. And because of this weight that you’re dragging around for the first two decades of your life after you get into adulthood, it is pushing, I think it directly impacts the next part of the trickle down effect of what does it look like when you buy a house, you know, and then you face, because after you get out of college, by the way, you have to go buy your new car to get to your reliable transportation. Well, now if that is 50% higher inflation rate than just what it should cost to buy the vehicles back in 1980s, all these things are building upon themselves and making it much harder for the younger generations to kind of keep up. And that’s the part why I think when I wrote Millionaire Mission, I had an entire section because you’re not powerless on this whole thing. I’m just telling you be an informed consumer and you are a consumer when it comes even to a very noble cause like education. Be very deliberate on where you go. Be very deliberate on what your major is because don’t just assume these institutions have your best interest at heart when you look at what has happened. You have to take a direct, you know, active role in those choices so that you can move forward and be successful for the future.
Bo: All right. So, if we’re keeping a scorecard and we’re thinking through all these different metrics for the folks starting out in 1980, the baby boomers versus the Gen Z’s that are starting out today, it’s really interesting when you look at sort of the side by side comparison. And when you think about income, I would argue that young people today in today’s dollars in real terms are making more money than their baby boomer counterparts. But home prices have gotten substantially more expensive. And the costs of homes represent a significantly larger portion of median household income. Interest rates have come down, and even though they’re high relative to the last decade, they’re certainly more affordable than they were in the 1980s. But monthly payments haven’t changed all that much when we normalize for today’s dollars. The age at which a home buyer can buy their first home has changed dramatically. And the cost to better oneself, to go get a higher education has increased substantially.
Bo: So when you look at all this laid out, you still have to ask this question. Well, okay, was it actually easier or harder to build wealth in 1980 or for baby boomers than it is today? Well, some of that comes down to behavior. How well are you able to save and invest? If we’re trying to figure out how well you can save and invest, we have to answer the margin question. Which one of these generations had more margin available in their lives?
Brian: And this was fascinating. I love this whole research study we did because we were able, and the good news is our government tracks this. So through the Bureau of Labor Statistics, we were actually able to go pull and look at what a household looked like in 1980 and then go and pull this data. I can think of it at the end of 2024 and then compare and contrast and we’ve created this nice visual. And Bo, what did we find?
Bo: Yeah, it’s really interesting if you think about the categories that they were spending on in 1984. 30% on housing, 15% on food, 20% on transportation, 5% health care, 9% insurance and pensions, and then 22% in the quote unquote other category. And you lay that side by side with how consumers spend today. What you’re going to notice is that today housing is right around 33%, food is at 13%, transportation’s at 17%, healthcare is at 8%, insurance and pensions at 12 and a half, and others at 16%. By and large, other than the fact that healthcare is more expensive and insurance and pensions are more expensive, there’s not a whole lot difference in the way that spending is broken out. It looks awfully similar to how it did back in 1984.
Brian: I think it’s so interesting. It shows me we’ve changed, added 50 plus years, but as humans kind of the same. And that’s why it’s really the big ticket items that are kind of hurting people. It’s your education decisions. It’s the car you drive. It’s the house you live in. And that’s why, guys, we’ve created rules for every one of these things. And I think that’s why it’s important if you don’t go out there and go to moneyguy.com/resources to understand how you navigate these big life decisions because yes, it will impact what happens in your life.
Brian: I think it is also important to make sure that you’re thinking about this not as a victim, that you’re thinking about this as how do I be a financial mutant. This is so important because every generation has struggles. Bo, walk them through how everybody has issues.
Bo: Yeah, we just went through the baby boomers when they were coming out. It was high inflation and really unfavorable interest rates. Brian, if we look at your generation, you guys had to make it through two significant market crashes, the dot com bubble bursting in the 2000s and then the great recession in 2008. If you think about my generation, the millennials, we’re the ones that have rampant student loan debt and we’ve seen this unbelievable rise in home prices. And then we think about the generation coming out right now, the young people that are just starting to forge their way. They’re just now entering the workforce and everything is expensive. Housing is expensive, transportation is expensive, healthcare is expensive. Every one of these generations has faced headwinds. Does that mean that one generation had it easier or more difficult than the other? Not necessarily. We all have our problems. So, if you’re living right now in today’s moment, we want to encourage you. What are the things that you should be thinking of? And rather than looking back and playing the comparison game, what are the things you ought to be aware of today? And what are the things that you should be taking note of and archiving away right now as a unique generational advantage.
Brian: Well, I want to flip the script because look, we’ve told you the big ticket items, yes, they are more expensive. However, the tools for actually building wealth are easier and better. And by the way, we live now in an economy with the law of accelerating returns, which is getting better and faster on how big the pizza pie is growing and at the speed that all this is expanding as well. Let’s kind of get into the details on this. What are some generational advantages that we have right now? First of all, cheap and automatic investing. You have to understand when I came out of college and I was curious about how money worked and I had my first bit of margin that I wanted to put to work, I had to go find an insurance broker that I gave them so I could start doing my $100 a month. And I was buying into class B, meaning heavily commissioned mutual fund shares. I wasn’t buying index funds because nobody was buying index funds back then because they didn’t really exist in a lot of ways. I was buying some manager who I was paying a fortune to and I was paying all these commissions and that was all I could do. The do-it-yourself did not exist. There was a gatekeeper and that was the person that sold it to you. That’s just not the way it works. Now it’s lower fees and it’s you do this. It’s your own part because you’ve got the education and the knowledge to do it.
Bo: Another huge advantage that this generation has right now is not different than the baby boomers had when they came out, is not different than the Xers had or the millennials. That right now, if you happen to be a young person, time is on your side. Do you recognize that one of the most valuable resources you have in your entire arsenal of wealth-building is simply your time? If you cannot squander it and you can take advantage of it, if you don’t believe us, think about these numbers. As we say all the time, for a 20-year-old, if you want to save a million dollars by the time that you retire, it only requires you to save $95 a month. It’s that easy. But if instead of starting at 20, you wait until 30, it is now four times harder. Instead of only having to save $95 a month, now you have to save $340 a month to get to the same finish line. If you wait all the way until you get to 40, now it is 10 times harder to get to the same level of wealth that you could have gotten to had you just started a little bit early. So maybe you’re 25, you didn’t start at 20. That’s okay. Start now. Maybe you’re 30 and you didn’t start at 25. That’s okay. The absolute best time in the world to start saving and investing was yesterday, which makes today the second best time to start saving and investing.
Brian: And this other one, this hits near and dear to my heart because this is kind of what went into the origin story of the Money Guy show is that overall financial literacy, guys, it is so much easier. I’ve told you my life was changed when I read The Wealthy Barber and The Millionaire Next Door, back in the mid 90s. And I’ve tried to carry that legacy forward with writing this book, Millionaire Mission. But there’s a step in between that is that now think of all the podcasts, think of all the YouTube, think of all the easy access points where you can actually figure out how to do this yourself.
Bo: Yeah, it’s really interesting. The content team came up with this great illustration to show what it was that actually changed the financial world. And now I don’t know where they got their data from, but I can only assume that this is accurate. If you’re out there listening in podcast, you want to check this out. Essentially, the availability of financial information was pretty static through the 1980s and 1990s, even through the early 2000s. But then around 2006, something happened. Something changed and all of the sudden fantastic free financial information was available to the masses. And since then, we’ve just gotten way, way better at making sound and solid financial decisions ever since that point in January of 2006.
Brian: Yeah, I like to, you know, this was the formation of the abundance cycle is that I just realized I wanted people to know what I didn’t know. I wanted, when I came out of school with big ambition but just not the knowledge, how do I better myself through money? And I was like, man, I don’t want the next person who feels the exact same way to come out and not know what to do. And that pureness of mission has just expanded and grown. But I think that we can take that pureness of mission on you bettering yourself, understanding how you can command your army of dollar bills better.
Brian: What are the key takeaways from this? The first thing, and y’all know this, comparison is the thief of joy. So don’t let comparison lead to excuses and inaction because this is the part where, and I’ve already kind of started to go this way earlier, is don’t be the villain or the victim. I really do want you to be the financial mutant. Look at your situation. Make good decisions with all the major life things that maybe are working against you, but then leverage off the things that are working to your benefit with all the technology changes, the access changes, the education opportunities. You can do this. Don’t let somebody tell you it’s not possible.
Bo: Yeah. Every single generation had headwinds. Every single generation had stuff that made their path and their journey difficult. But they also had unique and distinct advantages that for the financial mutants of that generation, if they were able to recognize those, able to take advantage of those, they were likely able to overcome those headwinds that they faced. So no matter where you’re sitting right now, find how you can focus on the legitimate positives. If you’re a young person, maybe you don’t have a ton of margin, but you have a ton of time. That’s wonderful. Maybe you’re a little bit older and you don’t have as much time, but now you’re in your peak earning years. Figure out how you can really increase your margin and put that money to work. Figure out what positives you have in your corner right now and how can you take advantage of them so that you can build your great big beautiful tomorrow.
Brian: Yeah. I mean, don’t forget the three ingredients to wealth. Just be disciplined. Live on less than you make and actually put your money to work and sooner, early and often is your friend on this. That’s the biggest, when we interview all of our millionaire clients, that’s the biggest takeaway is that they always say, “I’m so happy I discovered the power of compounding growth and letting my money work.” And that’s why, guys, we have done everything in our power. It really is that heart of an educator we have and believing in the abundance cycle that I’ve created a system with Bo that we really do believe that we’ll just give it away to you so that you can be the best version of yourself. And that’s why we have the Financial Order of Operations. It tells you exactly what to do with your next dollar. If you go to moneyguy.com/resources, you can download this free deliverable. And if you want to go a little deeper, now realize this was a course that we developed a few years ago and we were selling it for $250 something like that. Yeah. And we were like, wait a minute, let’s go ahead and not only update it, modernize it, but let’s also slash the heck out of the prices to make this more accessible to anybody and everybody out there. So, we dropped the price down to $49. And you were like, why would you do that? It really was the heart of an educator standpoint to it is that I wanted everybody out there to become the best version of themselves and that’s what we’ve invested in by trying to create this type of content.
Bo: No, we really do believe that there is a better way to do money. So no matter what generation you come from, no matter what your backstory is, how your journey began does not define how it ends. Figure out how you can build towards your beautiful tomorrow. Guys, this was a great exercise in going through the data, trying to create teachable, actionable things that you can do in your life. I’m your host, Brian, joined by Bo, rest of the Money Guy team. Money guy, out.


Free Resources
Here are the 9 steps you’ve been waiting for Building wealth is simple when you know what to do and the order in which to...

Free Resources
If you want to set yourself up for future success, find out how much you need to save every month to become a millionaire.

Free Resources
Here’s how you can buy a dependable car that won’t break the bank. Our free checklist walks you through the 20/3/8 rule and strategies to...

Articles
As mortgage rates have held relatively steady over the past few years, with average fixed 30-year rates between 6% and 8% since September of 2022,...

Articles
The desire to become an entrepreneur is alive and well in the United States. 62% of Americans wish to be their own boss, and among...

Articles
Money is a ubiquitous stressor. 71% of Americans say that money is a significant cause of stress in their lives. Financial stress is frequently caused...

How about more sense and more money?
Check for blindspots and shift into the financial fast-lane. Join a community of like minded Financial Mutants as we accelerate our wealth building process and have fun while doing it.
Free Resources
Here are the 9 steps you’ve been waiting for Building wealth is simple when you know what to do and the order in which to...
Free Resources
If you want to set yourself up for future success, find out how much you need to save every month to become a millionaire.
Free Resources
Here’s how you can buy a dependable car that won’t break the bank. Our free checklist walks you through the 20/3/8 rule and strategies to...

It's like finding some change in the couch cushions.
Watch or listen every week to learn and apply financial strategies to grow your wealth and live your best life.

Episodes
Are side hustles overrated? We have a hot take about side hustles, and we are ready to share a better approach to reach your financial...

Episodes
In this episode, we reveal our new and improved resource, answer your financial questions, and show how Mickey Mouse can help you build your great...

Episodes
Real estate built their $4.2M net worth, but will complexity could cost Jason and Candida their dream retirement? We analyze their plan to simplify 12...
Subscribe to our free weekly newsletter by entering your email address below.